Data Center UPS Market Expected to Reach USD 9.16 Billion by 2035, Registering 7.05% CAGR
Data Center UPS Market Size, Share and Research Report By UPS Type (Standby, Line-Interactive, Online

Press Release Disclaimer: This is a press release distributed through the XPR Media network. It has not been independently verified by our newsroom.

Data Center UPS Market Size, Share and Research Report By UPS Type (Standby, Line-Interactive, Online Double-Conversion, Delta-Conversion), By Battery Type
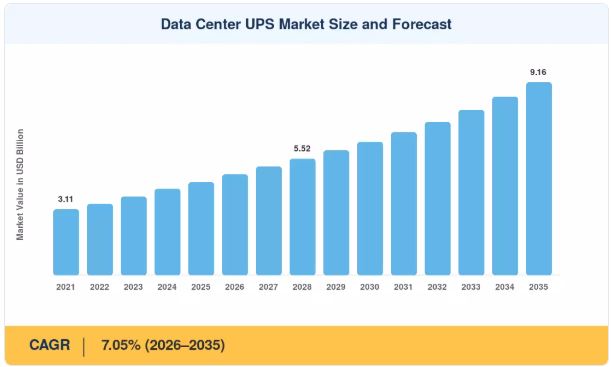
NEW YORK,, NY, UNITED STATES, August 25, 2026 /EINPresswire.com/ — The Global Data Center UPS market closed 2025 at USD 4.42 billion and enters the forecast window at USD 4.79 billion in 2026, climbing to USD 9.16 billion by 2035 at a 7.05% CAGR. Two catalysts anchor that trajectory. First, hyperscale capital expenditure crossed USD 300 billion globally in 2025 across the four largest cloud operators, and roughly 8-11% of every greenfield facility budget lands in the electrical backup chain. Second, grid interconnection queues in Northern Virginia, Dublin, and Singapore have pushed operators toward onsite energy assets that behave like power infrastructure rather than passive insurance. The market’s 7.05% CAGR reflects the convergence of AI and accelerated compute density (+2.1% impact), lithium chemistry cost decline (+1.4%), grid instability and interconnection delay (+1.2%), and sovereign and regional cloud mandates (+0.9%) accelerating across the world’s largest hyperscale and colocation construction economies simultaneously.
Replacement economics matter as much as new build. Valve-regulated lead-acid strings, the default for two decades, are being retired in favour of lithium chemistries that cut footprint by half and stretch service life past ten years. The U.S. Department of Energy’s 2024 efficiency work found that transformerless topologies operating in high-efficiency mode recover 2-4 percentage points of facility electrical loss, worth USD 1.1 million annually on a 100 MW campus. That payback, not sustainability messaging, is what unlocks retrofit budgets. North America holds 37.4% of the market in 2025, sustained by AI training campuses in Virginia, Texas, and Ohio. Asia-Pacific grows fastest at 8.9% CAGR as India’s data centre pipeline and China’s east-data-west-computing programme mature. Europe follows at 26.1% share, constrained by planning moratoria but lifted by EU Energy Efficiency Directive reporting duties. The next decade rewards vendors who sell power as a managed system, not a box.
Get Full PDF Sample Copy of Report: (Including Full TOC, List of Tables & Figures, Chart) @
https://www.marketresearchfuture.com/sample_request/30202
➤ How Significant Is the Data Center UPS Market’s Growth?
The data center UPS market’s trajectory from USD 4.42 billion in 2025 to a projected USD 9.16 billion by 2035 represents nearly a two-and-a-half-fold expansion over the forecast decade, reflecting the structural shift from lead-acid, standby-oriented backup power toward lithium-based, grid-interactive conversion systems purpose-built for AI-scale compute density. The market’s 7.05% CAGR is anchored in a compute-and-grid supercycle where accelerated rack power density, battery chemistry cost curves, and interconnection delay are all converging to make UPS infrastructure a strategic, revenue-generating asset rather than passive insurance.
Online double-conversion architectures command 61.8% of installed value, reflecting Tier III and Tier IV design mandates that isolate IT load from every upstream disturbance, while delta-conversion is growing at a 6.2% CAGR as efficiency-focused retrofits gain traction. Lithium-ion battery configurations expand at a 12.4% CAGR through 2035, the fastest-moving sub-segment in the market, while lead-acid VRLA still holds 54.3% of installed share though it erodes roughly three percentage points annually. Colocation facilities represent 34.9% of demand, driven by multi-tenant SLA exposure, while hyperscale and cloud self-build grows at a 9.6% CAGR, outpacing enterprise on-premise deployment as operators buy direct from manufacturers on multi-year frame agreements. Modular scalable frames account for USD 1.94 billion of 2025 revenue as operators defer capacity spend.
➤ What Does the Future Hold for the Data Center UPS Market?
AI and accelerated compute density contributes approximately 2.1 percentage points to the data center UPS market’s CAGR the single highest driver impact. Training clusters now draw 80-130 kW per rack against the 6-8 kW that governed design assumptions in 2018, a shift that compresses the electrical room and forces higher power-density conversion equipment. The International Energy Agency projects global data centre electricity consumption reaching roughly 945 TWh by 2030, more than double the 2022 baseline of 460 TWh, and every incremental terawatt-hour flows through backup conversion equipment sized to full IT load, which is why order books at the top four vendors extended past 60 weeks during 2025.
Lithium chemistry cost decline contributes approximately 1.4 percentage points to the CAGR, establishing battery economics as a primary structural driver. Cell prices fell to approximately USD 115 per kWh in 2024, down 68% from 2018 levels, and total cost of ownership modelling now favours lithium over VRLA within 5.5 years on typical Tier III runtime profiles, against 9 years in 2019. Floor-space recovery adds a second layer of value, as a 1 MW lithium installation occupies roughly 45% of equivalent VRLA footprint, with reclaimed white space in Ashburn carrying an implied lease value above USD 900 per square metre annually. Grid instability and interconnection delay adds a further 1.2% as Dominion Energy signalled interconnection timelines stretching to 2028-2030 for parts of Loudoun County and Ireland’s EirGrid maintained its Dublin connection restriction through 2028, pushing operators toward longer autonomy and grid-interactive capability.
The next phase of the market’s evolution centers on autonomous power management, with predictive analytics on cell impedance, thermal signature, and switching behaviour expected to move maintenance from calendar-based to condition-based across most of the installed fleet by 2032, with vendors already reporting 30-40% reductions in unplanned intervention on instrumented estates. Backup is also becoming a grid asset, with utilities in PJM and ERCOT now accepting qualifying storage into capacity and ancillary markets, 2025 PJM capacity clearance rates reaching USD 329.17 per MW-day, and a 20 MW facility using half of its stored energy able to produce seven-figure yearly revenue that changes backup from a cost center to a contributor. Scope 2 disclosure under CSRD and equivalent regimes will place facility efficiency in audited filings by 2028, with buyers demanding conversion efficiency evidence, embodied carbon declarations, and end-of-life documentation as standard tender attachments, while electrification pressure from EVs, renewables, and industrial demand keeps competing for the same wafer and magnetics capacity that sustains component cost pressure across the forecast decade.
Get access to the full description of the report @
https://www.marketresearchfuture.com/reports/data-center-ups-market-30202
➤ Who Are the Key Players in the Data Center UPS Market?
Concentration in the data center UPS market is moderate. The top five suppliers hold an estimated 54-59% of global value, producing an implied Herfindahl-Hirschman Index in the 900-1,150 band, competitive by regulatory standards, but with clear tiering between global platform vendors and regional specialists. Differentiation has shifted from hardware efficiency, where the field has converged, toward software, service networks, and battery supply security. MRFR identifies the following key participants with estimated revenue share ranges:
Schneider Electric (~17–21% share)
Vertiv Holdings (~15–19% share)
Eaton Corporation (~12–15% share)
ABB (~6–9% share)
Huawei Technologies (~4–7% share)
Legrand (~4–6% share)
Delta Electronics (~3–6% share)
Toshiba (~3–5% share)
Mitsubishi Electric (~3–5% share)
Riello Elettronica (~2–4% share)
Strategic competition in the data center UPS market is increasingly defined by battery supply security and service-network density with the capital cost of lithium retrofit cited as a top structural headwind, as a lithium conversion on a 20 MW facility carries USD 14-19 million in equipment and commissioning cost, causing boards weighing that against GPU procurement to routinely defer, alongside power semiconductor supply constraints where high-voltage SiC device allocations restrain supply with component lead times of 40 to 52 weeks, fire code and permitting friction under NFPA 855 adding 8-16 weeks to retrofit permitting, a skilled commissioning labour shortage, and alternative topology substitution.
➤ What Are the Emerging Trends in the Data Center UPS Market?
Several transformational trends are redefining the data center UPS market’s evolution through 2035:
AI and Accelerated Compute Density: Training clusters now draw 80-130 kW per rack against the 6-8 kW that governed design assumptions in 2018, with global data centre electricity consumption projected to reach roughly 945 TWh by 2030, more than double the 2022 baseline, forcing higher power-density conversion equipment across every new build.
Grid-Interactive Assets and Demand Response Revenue: Backup fleets that lie idle 99.9% of the year are stranded capital, and utilities in PJM and ERCOT now accept qualifying storage into capacity and ancillary markets, with 2025 PJM capacity clearance rates reaching USD 329.17 per MW-day, converting backup from a cost center to a contributor.
India, Indonesia, and the Sovereign Cloud Buildout: India has announced a data center pipeline of over 4.5 GW across Mumbai, Chennai, and Hyderabad, supported by state-level capital subsidies of 20-25% on electrical infrastructure, with these greenfield initiatives favouring lithium and modular designs by default rather than displacement.
Service Contracts and Outcome-Based Monetisation: Attached service revenue, including monitoring, predictive battery analytics, and guaranteed availability, carries gross margins roughly double hardware, with vendors shifting toward subscription models priced per megawatt of protected load and remote diagnostics detecting cell degradation weeks before failure.
Second-Life Battery Reuse and Circular Compliance: EU Battery Regulation carbon footprint declarations and recycled-content thresholds phase in from 2027, with vendors establishing certified take-back and second-life pathways gaining a tender advantage in Europe as retired data centre cells retain 70-80% capacity, sufficient for stationary renewable firming.
Buy Full Research Report:
https://www.marketresearchfuture.com/checkout?currency=one_user-USD&report_id=30202
➤ How Is the Data Center UPS Market Segmented?
The data center UPS market report provides a comprehensive segmentation framework:
By UPS Type: Standby (USD 0.31 billion, 2025), Line-Interactive (11.4% share, 2025), Online Double-Conversion (61.8% share, 2025), Delta-Conversion (6.2% CAGR)
By Battery Type: Lead-Acid VRLA (54.3% share, 2025), Lithium-Ion (12.4% CAGR), Nickel-Zinc & Other (USD 0.14 billion, 2025)
By Data Center Type: Colocation (34.9% share, 2025), Hyperscale / Cloud (9.6% CAGR), Enterprise (USD 1.06 billion, 2025), Edge (10.8% CAGR)
By Architecture: Centralized (58.9% share, 2025), Distributed / Modular (USD 1.94 billion, 2025)
By Power Capacity: ≤20 kVA (7.1% CAGR), 21–100 kVA (14.7% share, 2025), >100 kVA (8.4% CAGR)
By Tier Type: Tier 1 and 2, Tier 3, Tier 4
By Data Center Size: Small, Medium, Large
By Region: North America (37.4% share, 2025), Asia-Pacific (27.8% share, 2025), Europe (26.1% share, 2025), Middle East & Africa (6.6% share, 2025), South America (2.1% share, 2025)
➤ What Are the Regional Insights from the Data Center UPS Market?
North America holds 37.4% of the data center UPS market in 2025, with the United States commanding 84.2% of regional share through hyperscale AI cluster construction, where Loudoun County alone hosts more commissioned capacity than most national markets and its constraint is no longer land but transformer and interconnection availability. Texas has absorbed the overflow, with ERCOT’s large-load interconnection queue exceeding 100 GW of requests by late 2025. Canada holds 10.1% of regional share through hydro-powered colocation growth in Quebec and Manitoba marketed against carbon-conscious tenants, and Mexico holds 5.7% of regional share as the Querétaro cluster has drawn commitments from three major cloud providers since 2023.
Europe follows at 26.1% share of the data center UPS market, where Frankfurt, London, Amsterdam, Paris, and Dublin remain the reference cluster, though three of the five now operate under planning or grid restrictions. Germany commands 22.4% of regional share through Frankfurt interconnection density, with Germany’s Energy Efficiency Act setting binding PUE thresholds of 1.2 for facilities commissioned from July 2026, raising the specification bar on conversion efficiency for every new German installation. The UK holds 19.8% of regional share through London availability zone expansion, France holds 14.1% through its nuclear baseload cost advantage, Italy holds 8.9% through Milan submarine cable landing, Spain holds 8.2% through Aragón renewable-adjacent campuses, the Nordic countries hold 11.6% through free cooling and low power cost, Russia holds 3.7% through domestic sovereign infrastructure, and the rest of Europe holds 11.3% as Dublin’s connection freeze pushes overflow demand toward secondary hubs.
Asia-Pacific grows fastest in the data center UPS market at an 8.9% CAGR, representing 27.8% of global share. China commands 38.6% of regional share through its national computing network programme, which directs eastern demand toward western clusters in Guizhou, Inner Mongolia, and Gansu, where power costs run 30-40% below coastal rates. India holds 19.2% of regional share through its announced 4.5 GW pipeline, with the country’s data centre policy framework granting infrastructure status that unlocks cheaper long-tenor debt for electrical systems. Japan holds 14.4% through Osaka and Inzai cluster renewal, South Korea holds 9.1% through semiconductor-adjacent compute, ASEAN holds 13.5% as Johor absorbed the demand Singapore’s moratorium displaced, adding more than 1.5 GW of announced capacity in three years, and the rest of Asia-Pacific holds 5.2% through Australian sovereign cloud.
➤➤➤ Industry Analysis Reports by Market Research Future:
Autonomous Vehicles Market
https://www.marketresearchfuture.com/reports/autonomous-vehicles-market-1020
Rfid Tags Market
https://www.marketresearchfuture.com/reports/rfid-tags-market-2008
Precision Farming Market
https://www.marketresearchfuture.com/reports/precision-farming-market-2066
Industry 4.0 Market
https://www.marketresearchfuture.com/reports/industry-4-0-market-2375
Energy Management System Market
https://www.marketresearchfuture.com/reports/energy-management-system-market-2808
Telecom Equipment Market
https://www.marketresearchfuture.com/reports/telecom-equipment-market-4441
Advanced Metering Infrastructure Market
https://www.marketresearchfuture.com/reports/advanced-metering-infrastructure-market-5185
Photo Booth/Kiosk Market
https://www.marketresearchfuture.com/reports/photo-booth-kiosk-market-11030
Ground Penetrating Radar Market
https://www.marketresearchfuture.com/reports/ground-penetrating-radar-market-11074
Smart Building Market
https://www.marketresearchfuture.com/reports/smart-building-market-1860
Market Research Future
Market Research Future
+1 855-661-4441
email us here
Legal Disclaimer:
EIN Presswire provides this news content “as is” without warranty of any kind. We do not accept any responsibility or liability
for the accuracy, content, images, videos, licenses, completeness, legality, or reliability of the information contained in this
article. If you have any complaints or copyright issues related to this article, kindly contact the author above.

Media gallery