Alexandria Real Estate Equities, Inc. Reports 2Q26 and 1H26 Net (Loss) Income per Share – Diluted of $(0.43) and $1.68, respectively, and 2Q26 and 1H26 FFO per Share – Diluted, as Adjusted, of $1.73 and $3.46, respectively
PASADENA, Calif., Aug. 3, 2026

Press Release Disclaimer: This is a press release distributed through the XPR Media network. It has not been independently verified by our newsroom.

Alexandria Real Estate Equities, Inc. Reports 2Q26 and 1H26 Net (Loss) Income per Share – Diluted of $(0.43) and $1.68, respectively, and 2Q26 and 1H26 FFO per Share – Diluted, as Adjusted, of $1.73 and $3.46, respectively
PR Newswire
PASADENA, Calif., Aug. 3, 2026

PASADENA, Calif., Aug. 3, 2026 /PRNewswire/ — Alexandria Real Estate Equities, Inc. (NYSE: ARE) announced financial and operating results for the second quarter ended June 30, 2026.

|
KEY HIGHLIGHTS |
||||||||
|
Operating results |
2Q26 |
2Q25 |
1H26 |
1H25 |
||||
|
Net (loss) income attributable to Alexandria’s common stockholders – diluted: |
||||||||
|
In millions |
$ (73.7) |
$ (109.6) |
$ 286.7 |
$ (121.2) |
||||
|
Per share |
$ (0.43) |
$ (0.64) |
$ 1.68 |
$ (0.71) |
||||
|
Funds from operations attributable to Alexandria’s common stockholders – diluted, as adjusted: |
||||||||
|
In millions |
$ 296.1 |
$ 396.4 |
$ 592.0 |
$ 788.4 |
||||
|
Per share |
$ 1.73 |
$ 2.33 |
$ 3.46 |
$ 4.63 |
||||
A best-in-class REIT with a high-quality and diverse tenant base, strong margins, and long lease terms
|
(As of or for the three months ended June 30, 2026, unless stated otherwise) |
|||
|
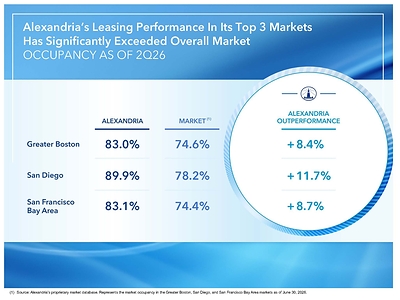
Occupancy of operating properties |
86.9 % |
||
|
Occupancy of operating properties, including executed leases with future occupancy |
90.9 % |
||
|
Percentage of annual rental revenue in effect from Megacampus platform |
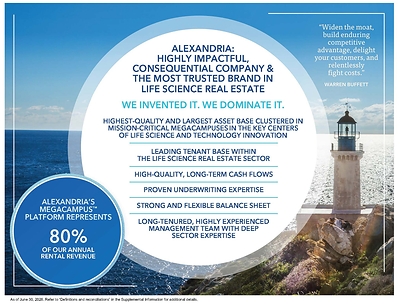
80 % |
||
|
Percentage of annual rental revenue in effect from investment-grade or publicly |
57 % |
||
|
Operating margin |
69 % |
||
|
Adjusted EBITDA margin |
67 % |
||
|
Percentage of leases containing annual rent escalations |
97 % |
||
|
Weighted-average remaining lease term: |
|||
|
Top 20 tenants |
10.0 |
years |
|
|
All tenants |
7.7 |
years |
|
|
Strong 2Q26 tenant collections(1): |
|||
|
2Q26 rents and receivables collected as of August 3, 2026 |
99.9 % |
||
|
(1) Refer to “Tenant collections” under “Definitions and reconciliations” in the Supplemental Information. |
|||
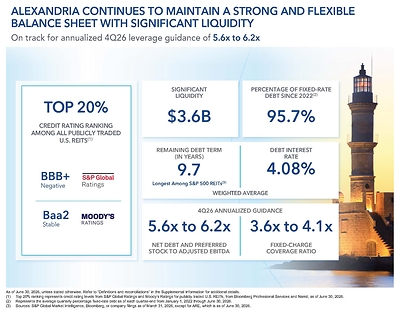
Strong and flexible balance sheet with significant liquidity; top 20% credit rating ranking among all publicly traded U.S. REITs; long-duration remaining debt term (as of 6/30/26)
- $21.84 billion in total market capitalization.
- $9.02 billion in total equity capitalization.
- Net debt and preferred stock to Adjusted EBITDA of 7.0x and fixed-charge coverage ratio of 3.3x for 2Q26 annualized; 4Q26 annualized targets: 5.6x–6.2x and 3.6x–4.1x, respectively.
- We expect improvement in our quarter-annualized net debt and preferred stock to Adjusted EBITDA ratio in 2H26 as we complete dispositions, sales of partial interests, and other capital sources.
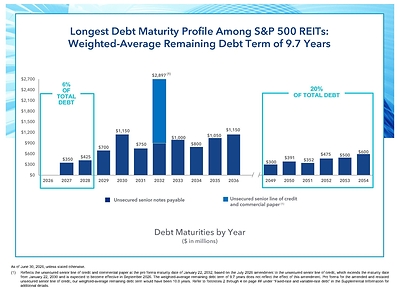
- Significant liquidity of $3.60 billion and extension of our $5.0 billion unsecured senior line of credit to 2032.
- Only 6% of our total debt matures through 2028.
- 9.7-year weighted-average remaining debt term, the longest among S&P 500 REITs.
- Total debt and preferred stock to gross assets of 31%.
- Intermediate-term goal for leverage: mid-5x range.
Solid 2Q26 leasing volume exceeding 1.0 million RSF
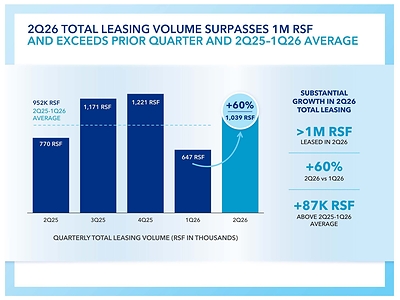
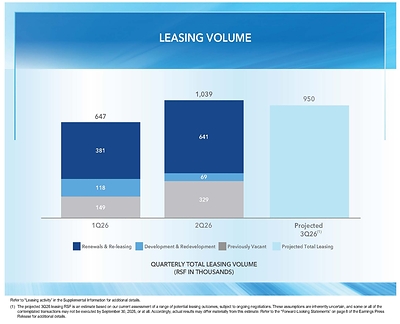
- 2Q26 total leasing volume surpassed 1.0 million RSF, increasing 60% from 1Q26 and exceeding the 2Q25–1Q26 quarterly average of 952,365 RSF by approximately 87,000 RSF.
- Includes 397,919 RSF for combined previously vacant and development and redevelopment space; second-highest amount since 2Q24, excluding the 466,598 RSF build-to-suit lease signed in 3Q25.
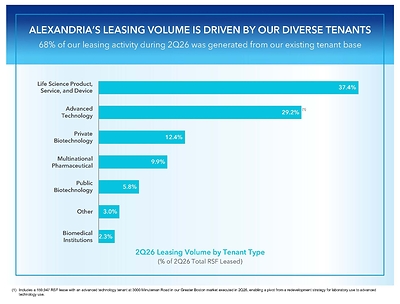
- 75% of our leasing activity during the last twelve months was generated from our existing tenant base.
|
Leasing Volume in RSF: |
2Q26 |
1Q26 |
1H26 |
|||||||||
|
Leasing of development and redevelopment space |
68,771 |
117,935 |
186,706 |
|||||||||
|
Leasing of previously vacant space |
329,148 |
148,734 |
477,882 |
|||||||||
|
397,919 |
266,669 |
664,588 |
||||||||||
|
Lease renewals and re-leasing of space |
640,998 |
380,687 |
1,021,685 |
|||||||||
|
Total leasing volume |
1,038,917 |
647,356 |
1,686,273 |
|||||||||
|
Lease renewals and re-leasing of space: |
||||||||||||
|
Rental rate changes |
(0.7) % |
(15.0) % |
(7.4) % |
|||||||||
|
Rental rate changes (cash basis) |
(4.3) % |
(15.8) % |
(9.6) % |
Ongoing execution of Alexandria’s capital recycling strategy
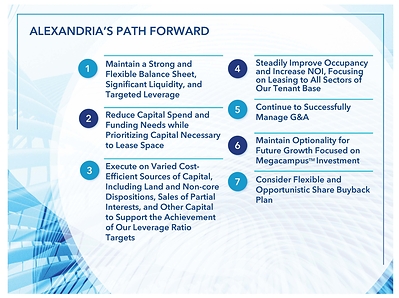
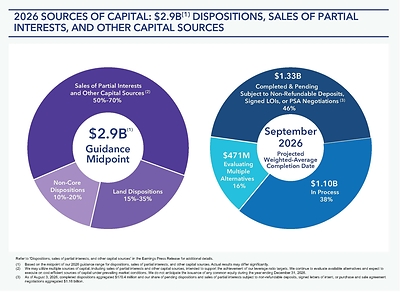
We plan to continue funding a significant portion of our capital requirements for the year ending December 31, 2026 through dispositions of land, non-core dispositions, sales of partial interests, and other capital sources.
|
(in millions) |
Sales Price |
% |
||
|
Completed as of August 3, 2026 |
$ 170 |
|||
|
Pending transactions subject to non-refundable deposits, signed letters of |
1,159 |
|||
|
1,329 |
46 % |
|||
|
Dispositions, sales of partial interests, and other capital sources in process |
1,100 |
38 % |
||
|
Multiple alternatives under evaluation |
471 |
16 % |
||
|
2026 guidance midpoint for dispositions, sales of partial interests, and |
$ 2,900 |
We expect to allocate this capital as follows (based on guidance midpoints):
|
(in millions) |
2026 |
|
|
Construction focused on highly leased developments and lease-up of vacant space |
$ 1,750 |
|
|
Reduction of debt to meet our leverage goal |
1,675 |
|
|
Net cash provided by operating activities, as adjusted |
(525) |
|
|
$ 2,900 |
Occupancy and leasing progress
|
Operating occupancy as of March 31, 2026 |
87.7 % |
|
|
Key changes to occupancy: |
||
|
Reclassification of space at 3000 Minuteman Road from redevelopment to operating |
(0.4) |
(1) |
|
Previously disclosed 2Q26 key lease expirations with expected downtime |
(0.8) |
|
|
Increase in occupancy, primarily due to the commencement of leases during 2Q26 |
0.4 |
|
|
Operating occupancy as of June 30, 2026 |
86.9 |
|
|
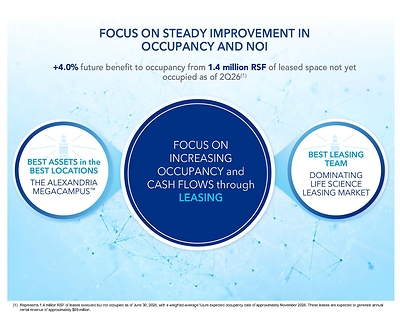
Vacant space with executed leases and future occupancy |
4.0 |
(2) |
|
Operating occupancy as of June 30, 2026, including executed leases with future |
90.9 % |
|
(1) |
Refer to “Reduction of capital spend and funding needs” in this Earnings Press Release for additional details regarding the 159,947 RSF lease executed in 2Q26. |
|
(2) |
Represents executed leases aggregating 1.4 million RSF with occupancy expected upon completion of building and/or tenant improvements. The weighted-average expected occupancy date is approximately November 2026, with expected annual rental revenue of approximately $69 million. We expect 64% of the total 1.4 million RSF to be occupied by December 31, 2026. These spaces are located primarily in the Greater Boston, San Diego, and San Francisco Bay Area markets. |
KEY OPERATING METRICS
|
Operating metrics |
2Q26 |
1H26 |
|||
|
Same property performance: |
|||||
|
Net operating income changes |
(10.6) % |
(1) |
(11.5) % |
(1) |
|
|
Net operating income changes (cash basis) |
(8.6) % |
(1) |
(11.2) % |
(1) |
|
|
Occupancy – current-period average |
87.1 % |
88.2 % |
|||
|
Occupancy – same-period prior-year average |
92.6 % |
93.5 % |
|
Refer to “Same property comparisons” and “Net operating income” under “Definitions and reconciliations” in the Supplemental Information for additional details and their respective reconciliations from the most directly comparable financial measures presented in accordance with GAAP. |
|
|
(1) |
The decline was due to a decrease in same property occupancy, primarily driven by previously disclosed key lease expirations with expected downtime aggregating 657,492 RSF in 1Q26 and 260,888 RSF in 2Q26, with weighted-average lease expiration dates of January 2026 and April 2026, respectively. |
Reduction of capital spend and funding needs
- In 2Q26, we executed a lease aggregating 159,947 RSF with an advanced technology tenant at our redevelopment project at 3000 Minuteman Road in our Greater Boston market. The lease enables us to pivot a portion of the redevelopment project from future laboratory and/or biomanufacturing use to a lower-cost advanced technology use, reducing the project’s expected aggregate construction budget by approximately $80 million. We expect to deliver the 159,947 RSF of leased space in 2Q27 upon completion of building and tenant improvements.
- As a result, the leased space was reclassified from redevelopment to operating, reducing the redevelopment project from 431,550 RSF as of 1Q26 to 271,603 RSF as of 2Q26.
- We continue to evaluate the business and financial strategy for five projects aggregating 1.4 million RSF, which may allow us to further reduce future construction funding requirements within our active pipeline.
- As of 2Q26, we executed letters of intent aggregating 108,800 RSF for advanced technology use at our redevelopment project at 311 Arsenal Street. If we are successful in executing these potential leases, we expect to evaluate whether all or a portion of this project will be placed back into operation without the need to further redevelop for laboratory use.
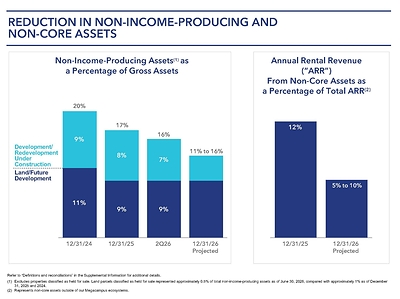
- Non-income-producing assets for 2Q26 are 16% of gross assets, a 4% reduction since 4Q24; targeting a range of 11% to 16% by 4Q26.
Alexandria’s development and redevelopment pipeline delivered incremental annual net operating income of $57 million during 2Q26, with an additional $42 million anticipated to be delivered by 4Q26
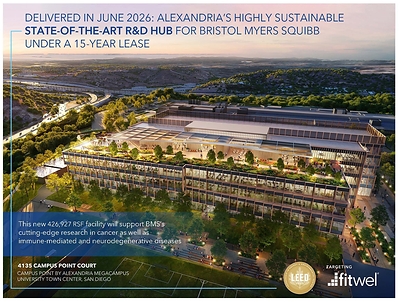
- During 2Q26, we placed into service one development project aggregating 426,927 RSF that is 100% occupied by Bristol Myers Squibb at 4135 Campus Point Court in our University Town Center submarket and delivered incremental annual net operating income aggregating $57 million.
- Annual net operating income (cash basis) from recently delivered projects is expected to increase by $40 million upon the burn-off of initial free rent, which has a weighted-average remaining period of approximately five months.
- 79% of the RSF in our total development and redevelopment pipeline is within our Megacampus ecosystems.
|
Development and Redevelopment |
Incremental Annual Net |
RSF |
Occupied/ Leased/ Negotiating Percentage |
|||||||||||
|
(dollars in millions) |
||||||||||||||
|
Placed into service in 1H26 |
$ 58 |
532,219 |
91 % |
|||||||||||
|
Expected to be placed into service: |
||||||||||||||
|
2H26 |
$ 42 |
(1) |
174,662 |
(2) |
84 % |
(3) |
||||||||
|
2027–2028 |
93 |
1,258,004 |
68 % |
|||||||||||
|
$ 135 |
||||||||||||||
|
(1) |
Includes expected partial deliveries through 2026 from projects expected to stabilize in 2027–2028, including speculative future leasing that is not yet fully committed. Refer to the initial and stabilized occupancy years under “New Class A/A+ development and redevelopment properties: under construction” in the Supplemental Information for additional details. |
||||||||||||
|
(2) |
Represents the RSF of projects expected to stabilize in 2026. Does not include RSF for partial deliveries through 2026 from projects expected to stabilize in 2027–2028. |
||||||||||||
|
(3) |
Represents the current leased/negotiating percentage of our 174,662 RSF development project that is expected to stabilize in 4Q26. |
Continued successful management of general and administrative expenses
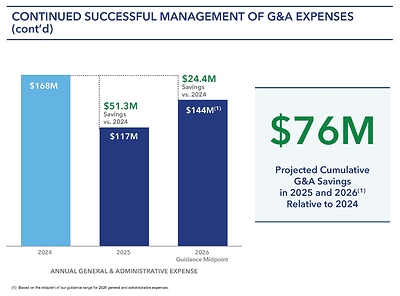
- General and administrative expenses for 2Q26 aggregated $36.9 million, an increase of $7.7 million, or 26.5%, from 2Q25, but a decrease of $7.8 million, or 17.4%, from 2Q24, reflecting the continued benefit from cost‑efficiency initiatives implemented in prior years. Some of the cost savings in 2025 were temporary, and approximately half of the cost reductions achieved in 2025 are expected to continue in 2026.
- Compared to 2024, we continue to expect approximately $76 million of cumulative general and administrative expense savings in 2025 and 2026 (based on the midpoint of our 2026 guidance range).
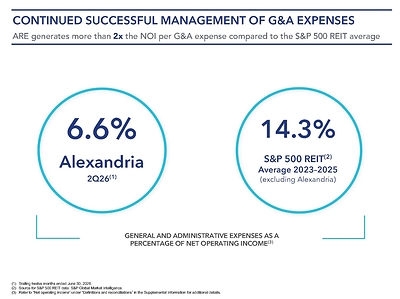
- For the trailing twelve months ended June 30, 2026, our general and administrative expenses represented 6.6% of net operating income, approximately half the average of other S&P 500 REITs for 2023–2025.
Key capital events
- In July 2026, we executed an agreement to amend our $5.0 billion unsecured senior line of credit. The amendment is expected to become effective in September 2026, upon the satisfaction of certain conditions. The amendment extends the maturity date from January 22, 2030 to January 22, 2032, including extension options that we control. In addition, the amendment reduces the applicable borrowing rate to SOFR plus 0.725% from the currently applicable SOFR plus 0.835%. In connection with the amendment, we expect to recognize a loss on early extinguishment of debt of approximately $3.3 million related to the partial write-off of unamortized loan fees in 3Q26.
- In April 2026, we repaid, upon maturity, $350.0 million of 3.80% unsecured senior notes payable. The repayment was funded temporarily with borrowings under our commercial paper program, which will be repaid through planned dispositions, sales of partial interests, and other capital sources included in our 2026 guidance. No gain or loss was incurred in connection with this repayment.
- Under our common stock repurchase program authorized in December 2025, we may repurchase up to $500.0 million of our common stock through December 31, 2026. As of June 30, 2026, no shares have been repurchased under this program and $500.0 million remains available for future share repurchases.
Dividend strategy to share net cash flows from operating activities with stockholders while retaining a significant portion for reinvestment
- Common stock dividend declared of $0.72 per share for 2Q26, consistent with the preceding quarter. The declared dividend per common share reflects our commitment to maintaining the strength of our balance sheet, enhancing financial flexibility, preserving liquidity, and sharing cash flows with our stockholders.
- Significant net cash provided by operating activities, as adjusted, retained for reinvestment aggregating $2.60 billion for the years ended December 31, 2022 through 2025 and the midpoint of our 2026 guidance range.
- Dividend yield of 5.4% as of June 30, 2026 and dividend payout ratio of 42% for the three months ended June 30, 2026.
Investments
- As of June 30, 2026:
- Our non-real estate investments aggregated $1.69 billion.
- Unrealized gains presented in our consolidated balance sheet were $223.9 million, comprising gross unrealized gains and losses aggregating $290.5 million and $66.6 million, respectively.
- Investment income of $133.2 million for 2Q26, presented in our consolidated statement of operations, consisted of $10.3 million of realized gains, $131.9 million of unrealized gains, and $9.0 million of impairment charges.
2026 Guidance
June 30, 2026
(Dollars in millions, except per share amounts)
Guidance for 2026 has been updated to reflect our current view of existing market conditions and assumptions for the year ending December 31, 2026. There can be no assurance that actual results will not be materially higher or lower than these expectations. Our guidance for 2026 is subject to a number of variables and uncertainties. Refer to our discussion of “forward-looking statements” in this Earnings Press Release as well as our SEC filings, including our most recent annual report on Form 10-K and any subsequent quarterly reports on Form 10-Q.
|
Projected 2026 Funds From Operations per Share Attributable to Alexandria’s Common Stockholders – Diluted |
As of 8/3/26 |
As of 4/27/26 |
Key Changes |
|||||||
|
Funds from operations per share, as adjusted(1) |
$6.35 to $6.45 |
$6.30 to $6.50 |
No change to midpoint; range narrowed by 10 cents(2) |
|||||||
|
Midpoint |
$6.40 |
$6.40 |
||||||||
|
Key Credit Metrics Targets |
As of 8/3/26 |
As of 4/27/26 |
Key Changes |
|||
|
Net debt and preferred stock to Adjusted EBITDA – 4Q26 annualized |
5.6x to 6.2x |
5.6x to 6.2x |
No Change |
|||
|
Fixed-charge coverage ratio – 4Q26 annualized |
3.6x to 4.1x |
3.6x to 4.1x |
||||
|
As of 8/3/26 |
As of 4/27/26 |
|||||||||||
|
Key Sources and Uses of Capital |
Range |
Midpoint |
Certain |
|||||||||
|
Sources of capital: |
||||||||||||
|
Net cash provided by operating activities, as adjusted |
$ 475 |
$ 575 |
$ 525 |
$ 525 |
||||||||
|
Dispositions, sales of partial interests, and other capital sources(3) |
2,100 |
3,700 |
2,900 |
(3) |
2,900 |
|||||||
|
Total sources of capital |
$ 2,575 |
$ 4,275 |
$ 3,425 |
$ 3,425 |
||||||||
|
Uses of capital: |
||||||||||||
|
Construction(4)(5) |
$ 1,500 |
$ 2,000 |
$ 1,750 |
$ 1,750 |
||||||||
|
Reduction in unsecured senior debt |
1,075 |
2,275 |
1,675 |
See below |
1,675 |
|||||||
|
Total uses of capital |
$ 2,575 |
$ 4,275 |
$ 3,425 |
$ 3,425 |
||||||||
|
Reduction in unsecured senior debt (included above): |
||||||||||||
|
Repayment of unsecured senior notes payable with 2026 maturities |
$ 650 |
$ 650 |
$ 650 |
$ |
650 |
$ 650 |
||||||
|
Tender offers for partial principal repayments of unsecured senior notes payable |
952 |
952 |
952 |
$ |
952 |
952 |
||||||
|
Issuance of unsecured senior notes payable |
(750) |
(750) |
(750) |
$ |
(750) |
(750) |
||||||
|
Unsecured senior line of credit, commercial paper, and other |
223 |
1,423 |
823 |
823 |
||||||||
|
Reduction in unsecured senior debt |
$ 1,075 |
$ 2,275 |
$ 1,675 |
$ 1,675 |
||||||||
Refer to “Definitions and reconciliations” in the Supplemental Information for additional details on key credit metrics.
|
(1) |
Refer to “Funds from operations and funds from operations, as adjusted, attributable to Alexandria Real Estate Equities, Inc.’s common stockholders” under “Definitions and reconciliations” in the Supplemental Information for additional details. |
|
(2) |
Refer to “2026 and 4Q26 funds from operations per share – diluted, as adjusted” below for additional details. |
|
(3) |
For the year ending December 31, 2026, we may utilize multiple sources of capital, including land and non-core dispositions, sales of partial interests, and other capital sources, to fund (i) construction focused on highly leased developments and lease-up of vacant space, and (ii) repayment of senior unsecured debt sufficient to achieve our net debt and preferred stock to Adjusted EBITDA – 4Q26 annualized target of 5.6x to 6.2x. We continue to evaluate available alternatives and expect to execute on varied cost-efficient sources of capital under prevailing market conditions. We do not anticipate the issuance of any common equity during the year ending December 31, 2026. As of August 3, 2026, completed dispositions aggregated $170.4 million, our share of pending dispositions and sales of partial interests subject to non-refundable deposits, signed letters of intent, or purchase and sale agreement negotiations aggregated $1.16 billion, and in-process dispositions, sales of partial interests, and other capital sources aggregated $1.10 billion, with the remaining $471.0 million representing multiple alternatives that we are currently evaluating. |
|
(4) |
We are currently evaluating our future construction spending estimates for 2027, and a number of factors could cause our preliminary estimates for 2027 to change as we refine our estimates over the next several months. As of August 3, 2026, our updated estimate of 2027 construction spending assumes a decline of $100 million to $600 million (relative to the $1.75 billion midpoint of our 2026 guidance range), resulting in an expected range of $1.15 billion to $1.65 billion, subject to market conditions. The updates to our 2027 construction spending outlook primarily reflect additional leasing activity since 1Q26, including recently executed leases and leases currently under negotiation, which has refined our expectations regarding the amount and timing of 2027 construction spending. |
|
(5) |
We expect 2027 construction spending to primarily focus on: (i) construction spending required to complete our development and redevelopment projects that are expected to stabilize through 2028 and are 71% leased, (ii) five projects under evaluation which may require significant capital to complete, and (iii) revenue- and non-revenue-enhancing capital expenditures, in order to secure leasing of vacant space and renewals and re-leasing of space at our operating properties. |
|
As of 8/3/26 |
As of 4/27/26 |
Key Changes to Midpoint |
|||||||||
|
Key Assumptions |
Low |
High |
Low |
High |
|||||||
|
Occupancy of operating properties as of December 31, 2026 |
86.2 % |
(1) |
87.8 % |
(1) |
86.2 % |
87.8 % |
No Change |
||||
|
Same property performance: |
|||||||||||
|
Net operating income changes |
(10.5) % |
(1) |
(8.5) % |
(1) |
(10.5) % |
(8.5) % |
|||||
|
Net operating income changes (cash basis) |
(10.5) % |
(1) |
(8.5) % |
(1) |
(10.5) % |
(8.5) % |
|||||
|
Lease renewals and re-leasing of space: |
|||||||||||
|
Rental rate changes |
(9.0) % |
(1.0) % |
(9.0) % |
(1.0) % |
|||||||
|
Rental rate changes (cash basis) |
(15.0) % |
(7.0) % |
(15.0) % |
(7.0) % |
|||||||
|
Straight-line rent revenue |
$ 45 |
$ 75 |
$ 55 |
$ 85 |
$10 million reduction(2) |
||||||
|
General and administrative expenses |
$ 134 |
$ 154 |
$ 134 |
$ 154 |
No Change |
||||||
|
Capitalization of interest |
$ 220 |
$ 260 |
$ 225 |
$ 265 |
$5 million reduction(3) |
||||||
|
Interest expense |
$ 260 |
$ 300 |
$ 240 |
$ 280 |
$20 million increase(4) |
||||||
|
Realized gains on non-real estate investments(5) |
$ 60 |
$ 90 |
$ 60 |
$ 90 |
No Change |
||||||
|
(1) |
Our guidance for occupancy of operating properties as of December 31, 2026, and for 2026 same property net operating income changes assumes a benefit of approximately 1% and 2%, respectively, related to a range of assets with vacancy that could potentially be sold during 2026 and/or qualify for classification as held for sale by December 31, 2026, but that had not yet met such criteria as of June 30, 2026. |
|
(2) |
Reduction driven primarily by write-offs and reserves of deferred rent related to tenant wind-downs. Our 2026 guidance continues to assume a $25 million to $30 million reduction in funds from operations related to potential tenant wind-downs, of which approximately $14 million was recognized during 1H26, including approximately $8 million recognized in 2Q26. |
|
(3) |
Reduction driven primarily by the achievement of certain milestone dates across several projects impacting 4Q26, including a potential decline related to projects for which we are evaluating business and financial strategies. Refer to the discussion of “2026 and 4Q26 funds from operations per share – diluted, as adjusted” and “Capitalization of interest” below, and “Capitalization of interest” in the Supplemental Information for additional details. |
|
(4) |
Includes: (i) an approximate $15 million increase resulting primarily from a shift of approximately six weeks in the weighted-average projected completion date of our 2026 dispositions, sales of partial interests, and other capital sources, from August 2026 to September 2026, and (ii) an approximate $5 million increase resulting primarily from the reduction in 2026 capitalization of interest in 4Q26 discussed in the footnote above. |
|
(5) |
Represents realized gains and losses included in funds from operations per share – diluted, as adjusted. Excludes unrealized gains and losses and significant gains and impairments realized on non-real estate investments, if any. Refer to “Investments” in the Supplemental Information for additional details. |
2026 and 4Q26 funds from operations per share – diluted, as adjusted
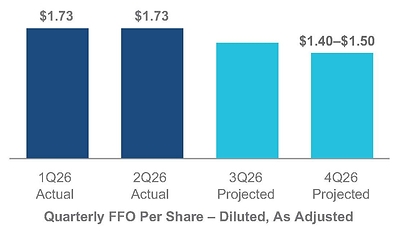
- On April 27, 2026, we provided a guidance range of $6.30 to $6.50 for projected 2026 funds from operations per share – diluted, as adjusted. On August 3, 2026, we narrowed this range to $6.35 to $6.45 while maintaining the midpoint of $6.40. Our outlook includes the following assumptions:
- The $6.40 midpoint of the guidance range for 2026 funds from operations per share – diluted, as adjusted, remains unchanged, as we expect the benefit from the later dispositions, sales of partial interests, and other capital sources to substantially offset the higher interest expense and lower capitalization of interest for 2026. The narrowed guidance range reflects additional visibility into our full-year outlook.
- We expect higher 3Q26 funds from operations per share – diluted, as adjusted, than previously assumed due to the approximately six-week shift in the weighted-average projected completion date of the dispositions, sales of partial interests, and other capital sources assumed at the midpoint of our 2026 guidance, from August to September 2026.
- During 4Q26, we expect lower capitalization of interest than previously assumed primarily driven by the achievement of certain milestone dates across several projects, including a potential decline related to projects for which we are evaluating business and financial strategies. The lower capitalized interest is expected to result in our 4Q26 funds from operations per share – diluted, as adjusted, being at the lower end of our previously provided, and now reiterated, range of $1.40 to $1.50.
1) Development-related other income
- During 1H26, we recognized development fees and other related revenues of approximately $5.6 million, or $11 million annualized, most of which are expected to cease by the end of 2026 as we complete the respective projects.
2) Development and redevelopment projects under business and financial strategy evaluation
- We have five development and redevelopment projects for which the business and financial strategies continue to be evaluated, including whether to continue construction of laboratory improvements, pause construction, pursue lower-investment construction alternatives (including a pivot to advanced technology use), or pursue a disposition. Refer to “New Class A/A+ development and redevelopment properties: under construction” in the Supplemental Information for additional details.
- If we elect to continue to pursue construction of laboratory improvements for these projects, the earliest deliveries of these projects are in 2028.
- If we elect to pursue lower-investment construction alternatives (including a pivot to advanced technology use), these projects could deliver earlier than 2028. The incremental capital required for alternative-use construction, and corresponding rental rates earned, are generally lower than those associated with laboratory improvements.
- In 2Q26, we executed a lease with an advanced technology tenant at the 3000 Minuteman Road redevelopment project in our Greater Boston market. This lease is for a lower-cost alternative use at lower rental rates and stabilized yields than our initial underwriting. Therefore, we placed one building at our 3000 Minuteman Road redevelopment project, aggregating 159,947 RSF, back into operation this quarter and included it in our operating occupancy as of June 30, 2026. Refer to the Earnings Press Release and “Leasing Activity” in the Supplemental Information for additional details.
- In addition, we have signed letters of intent at our 311 Arsenal Street redevelopment project for non-laboratory use, including advanced technology uses, aggregating 108,800 RSF. If we are successful in executing these potential leases for advanced technology use, we expect lower rental rates and stabilized yields than our initial underwriting.
3) Capitalization of interest
- We expect average real estate basis capitalized to decline from $6.94 billion for 1H26 to an updated range of $3.4 billion to $4.9 billion for 4Q26, primarily driven by the achievement of certain milestone dates across several projects due to deliveries of development and redevelopment projects, deliveries of leased vacant space under construction, and pauses in construction and pre-construction activities, including a potential decline related to projects for which we are evaluating business and financial strategies. The updated range for 4Q26 represents a $400 million reduction (at the midpoint) from the projected range of $3.8 billion to $5.3 billion that was previously disclosed on April 27, 2026. Refer to “Capitalization of interest” in the Supplemental Information for additional details.
- At each milestone date, we evaluate, on an asset-by-asset basis, whether to (i) proceed with additional pre-construction and/or construction activities based on leasing demand and/or market conditions, (ii) pause future investments, or (iii) consider potential dispositions of these real estate assets. If we cease the activities necessary to prepare a project for its intended use, costs related to such project, including interest, payroll, property taxes, insurance, and other costs directly related and essential to the construction of Class A/A+ properties, are expensed as incurred. Annualized capitalized operating expenses and payroll represent approximately 2% and 1%, respectively, of the total average real estate basis subject to capitalization for 1H26.
4) 2Q26 Key lease expirations
- We estimate 451 thousand RSF and 1.4 million RSF of leases expiring in 2026 and 2027 with approximately $18.1 million and $100.5 million of annual rental revenue, respectively, to have downtime after lease expiration. These 2026 and 2027 expirations have weighted-average contractual lease expiration dates of August 2026 and March 2027, respectively, and expected weighted-average downtime of 12 to 24 months. Refer to “Contractual lease expirations” in the Supplemental Information for additional details.
|
Key Lease Expirations |
|||||||
|
RSF |
Annual Rental |
Weighted-Average |
Weighted-Average |
||||
|
2026 |
451,450 |
$18.1 million |
August 2026 |
12 to 24 months |
|||
|
2027 |
1,377,960 |
$100.5 million |
March 2027 |
12 to 24 months |
|||
5) Dispositions, sales of partial interests, and other capital sources
- We may utilize multiple sources of capital, including land dispositions, non-core dispositions, sales of partial interests, and other capital sources to support the achievement of our leverage ratio targets beyond 2026, given (i) key lease expirations in 2027 with downtime and the factors previously described that could negatively impact EBITDA, (ii) construction spending required to complete our development and redevelopment projects that are expected to stabilize through 2028 and are 71% leased, and (iii) revenue- and non-revenue-enhancing capital expenditures required to secure leasing of vacant space and renewals and re-leasing of space at our operating properties. Refer to footnotes 4 and 5 under “Key sources and uses of capital” above for additional details.
We expect to introduce 2027 guidance and related key assumptions, and 2027 key sources and uses of capital at our Investor Day on December 2, 2026, consistent with our historical practice.
Dispositions, Sales of Partial Interests, and Other Capital Sources
June 30, 2026
(Dollars in thousands)
|
Date of |
Interest |
Square Footage |
Capitalization |
Capitalization (Cash Basis) |
Price (Our Share) |
|||||||||||||||
|
Property |
Submarket/Market |
Operating |
Future |
|||||||||||||||||
|
Completed in 2Q26 and 1H26 |
$ 7,350 |
|||||||||||||||||||
|
Completed in July 2026: |
||||||||||||||||||||
|
Land: |
||||||||||||||||||||
|
3825 and 3875 Fabian Way(1) |
Palo Alto/San Francisco Bay Area |
7/14/26 |
100 % |
228,000 |
250,000 |
N/A(1) |
163,000 |
|||||||||||||
|
Total completed 2026 dispositions as of August 3, 2026 |
170,350 |
|||||||||||||||||||
|
Our share of pending dispositions and sales of partial interests subject to non-refundable deposits, |
1,158,626 |
|||||||||||||||||||
|
1,328,976 |
||||||||||||||||||||
|
Dispositions, sales of partial interests, and other capital sources in process |
1,100,000 |
|||||||||||||||||||
|
Multiple alternatives under evaluation |
471,024 |
|||||||||||||||||||
|
$ 2,900,000 |
||||||||||||||||||||
|
2026 guidance range for dispositions, sales of partial interests, and other capital sources(2) |
$2,100,000 – $3,700,000 |
|||||||||||||||||||
|
Midpoint |
$ 2,900,000 |
|||||||||||||||||||
|
Weighted-average projected completion date of 2026 dispositions, sales of partial interests, and other capital sources |
September 2026 |
|||||||||||||||||||
|
(1) |
Represents one future development project aggregating 250,000 SF at 3825 Fabian Way and one operating building aggregating 228,000 RSF at 3875 Fabian Way in our Palo Alto submarket. These assets were acquired in 2019 with the intent to develop them for life science use. However, due to the project’s macroeconomic outlook, the assets no longer aligned with our strategy and were sold to a residential developer. Based on 2Q26 annualized results, the assets generated approximately $6.2 million of annual net operating income. |
|
(2) |
For the year ending December 31, 2026, we may utilize multiple sources of capital, including land and non-core dispositions, sales of partial interests, and other capital sources, to fund (i) construction focused on highly leased developments and lease-up of vacant space, and (ii) repayment of senior unsecured debt sufficient to achieve our net debt and preferred stock to Adjusted EBITDA – 4Q26 annualized target of 5.6x to 6.2x. We continue to evaluate available alternatives and expect to execute on varied cost-efficient sources of capital under prevailing market conditions. We do not anticipate the issuance of any common equity during the year ending December 31, 2026. |
Earnings Call Information and About the Company
June 30, 2026
We will host a conference call on Tuesday, August 4, 2026, at 2:00 p.m. Eastern Time (“ET”)/11:00 a.m. Pacific Time (“PT”), which is open to the general public, to discuss our financial and operating results for the second quarter ended June 30, 2026. To participate in this conference call, dial (833) 366-1125 or (412) 902-6738 shortly before 2:00 p.m. ET/11:00 a.m. PT and ask the operator to join the call for Alexandria Real Estate Equities, Inc. The audio webcast can be accessed at www.are.com in the “For Investors” section. A replay of the call will be available for a limited time from 4:00 p.m. ET/1:00 p.m. PT on Tuesday, August 4, 2026. The replay number is (855) 669-9658 or (412) 317-0088, and the access code is 5367901.
Additionally, a copy of this Earnings Press Release and Supplemental Information for the second quarter ended June 30, 2026 is available in the “For Investors” section of our website at www.are.com or by following this link: https://www.are.com/fs/2026q2.pdf.
For any questions, please contact corporateinformation@are.com; Joel S. Marcus, executive chairman and founder; Peter M. Moglia, chief executive officer and chief investment officer; Marc E. Binda, chief financial officer and treasurer; or Paula Schwartz, managing director of Rx Communications Group, at (917) 633-7790.
About the Company
Alexandria Real Estate Equities, Inc. (NYSE: ARE), an S&P 500® company, is a best-in-class, mission-driven life science REIT making a positive and lasting impact on the world. With our founding in 1994, Alexandria pioneered the life science real estate niche. Alexandria is the preeminent and longest-tenured owner, operator, and developer of collaborative Megacampus ecosystems in AAA life science and advanced technology innovation cluster locations, including Greater Boston, San Diego, the San Francisco Bay Area, Seattle, Maryland, Research Triangle, and New York City. As of June 30, 2026, Alexandria has a total market capitalization of $21.84 billion and an asset base that includes 36.0 million RSF of operating properties and 2.8 million RSF of Class A/A+ properties undergoing construction. Alexandria has a long-standing and proven track record of developing Class A/A+ properties clustered in highly dynamic and collaborative Megacampus environments that enhance our tenants’ ability to successfully recruit and retain world-class talent and inspire productivity, efficiency, creativity, and success. Alexandria also provides strategic capital to transformative life science companies through our venture capital platform. We believe our unique business model and diligent underwriting ensure a high-quality and diverse tenant base that results in higher occupancy levels, longer lease terms, higher rental income, higher returns, and greater long-term asset value. For more information on Alexandria, please visit www.are.com.
Forward-Looking Statements
This document includes “forward-looking statements” within the meaning of Section 27A of the Securities Act of 1933, as amended, and Section 21E of the Securities Exchange Act of 1934, as amended. Such forward-looking statements include, without limitation, statements regarding our projected 2026 funds from operations per share, projected 2026 funds from operations per share, as adjusted, projected net operating income, and our projected sources and uses of capital. You can identify the forward-looking statements by their use of forward-looking words, such as “forecast,” “guidance,” “goals,” “projects,” “estimates,” “anticipates,” “believes,” “expects,” “intends,” “may,” “plans,” “seeks,” “should,” “targets,” or “will,” or the negative of those words or similar words. These forward-looking statements are based on our current expectations, beliefs, projections, future plans and strategies, anticipated events or trends, and similar expressions concerning matters that are not historical facts, as well as a number of assumptions concerning future events. There can be no assurance that actual results will not be materially higher or lower than these expectations. These statements are subject to risks, uncertainties, assumptions, and other important factors that could cause actual results to differ materially from the results discussed in the forward-looking statements. Factors that might cause such a difference include, without limitation, our failure to obtain capital (debt, construction financing, and/or equity) or refinance debt maturities, lower than expected yields, increased interest rates and operating costs, adverse economic or real estate developments in our markets, our failure to successfully place into service and lease any properties undergoing development or redevelopment and our existing space held for future development or redevelopment (including new properties acquired for that purpose), our failure to successfully operate or lease acquired properties, decreased rental rates, increased vacancy rates or failure to renew or replace expiring leases, defaults on or non-renewal of leases by tenants, adverse general and local economic conditions, an unfavorable capital market environment, decreased leasing activity or lease renewals, failure to obtain LEED and other healthy building certifications and efficiencies, and other risks and uncertainties detailed in our filings with the Securities and Exchange Commission (“SEC”). Accordingly, you are cautioned not to place undue reliance on such forward-looking statements. All forward-looking statements are made as of the date of this Earnings Press Release and Supplemental Information, and unless otherwise stated, we assume no obligation to update this information and expressly disclaim any obligation to update or revise any forward-looking statements, whether as a result of new information, future events, or otherwise. For more discussion relating to risks and uncertainties that could cause actual results to differ materially from those anticipated in our forward-looking statements, and risks to our business in general, please refer to our SEC filings, including our most recent annual report on Form 10-K and any subsequent quarterly reports on Form 10-Q.
This document is not an offer to sell or a solicitation to buy securities of Alexandria Real Estate Equities, Inc. Any offers to sell or solicitations to buy our securities shall be made only by means of a prospectus approved for that purpose. Unless otherwise indicated, the “Company,” “Alexandria,” “ARE,” “we,” “us,” and “our” refer to Alexandria Real Estate Equities, Inc. and our consolidated subsidiaries. Alexandria®, Lighthouse Design® logo, Building the Future of Life-Changing Innovation®, That’s What’s in Our DNA®, Megacampus™, At the Vanguard and Heart of the Life Science Ecosystem™, Alexandria Center®, Alexandria Technology Square®, Alexandria Technology Center®, and Alexandria Innovation Center® are copyrights and trademarks of Alexandria Real Estate Equities, Inc. All other company names, trademarks, and logos referenced herein are the property of their respective owners.
|
Consolidated Statements of Operations |
||||||||||||||
|
Three Months Ended |
Six Months Ended |
|||||||||||||
|
6/30/26 |
3/31/26 |
12/31/25 |
9/30/25 |
6/30/25 |
6/30/26 |
6/30/25 |
||||||||
|
Revenues: |
||||||||||||||
|
Income from rentals |
$ 643,210 |
$ 653,013 |
$ 728,872 |
$ 735,849 |
$ 737,279 |
$ 1,296,223 |
$ 1,480,454 |
|||||||
|
Other income |
19,574 |
18,009 |
25,542 |
16,095 |
24,761 |
37,583 |
39,744 |
|||||||
|
Total revenues |
662,784 |
671,022 |
754,414 |
751,944 |
762,040 |
1,333,806 |
1,520,198 |
|||||||
|
Expenses: |
||||||||||||||
|
Rental operations |
207,336 |
224,142 |
232,543 |
239,234 |
224,433 |
431,478 |
450,828 |
|||||||
|
General and administrative |
36,861 |
34,685 |
28,020 |
29,224 |
29,128 |
71,546 |
59,803 |
|||||||
|
Interest |
64,342 |
64,584 |
65,674 |
54,852 |
55,296 |
128,926 |
106,172 |
|||||||
|
Depreciation and amortization |
304,384 |
305,441 |
322,063 |
340,230 |
346,123 |
609,825 |
688,185 |
|||||||
|
Impairment of real estate |
222,470 |
5,499 |
1,717,188 |
323,870 |
129,606 |
227,969 |
161,760 |
|||||||
|
Total expenses |
835,393 |
634,351 |
2,365,488 |
987,410 |
784,586 |
1,469,744 |
1,466,748 |
|||||||
|
Equity in earnings (losses) of unconsolidated real estate joint ventures |
413 |
(147) |
(304) |
201 |
(9,021) |
266 |
(9,528) |
|||||||
|
Investment income (losses) |
133,227 |
(4,582) |
(3,890) |
28,161 |
(30,622) |
128,645 |
(80,614) |
|||||||
|
Gain (loss) on early extinguishment of debt |
— |
366,435 |
— |
(107) |
— |
366,435 |
— |
|||||||
|
Gain on sales of real estate |
— |
— |
619,914 |
9,366 |
— |
— |
13,165 |
|||||||
|
Net (loss) income |
(38,969) |
398,377 |
(995,354) |
(197,845) |
(62,189) |
359,408 |
(23,527) |
|||||||
|
Net income attributable to noncontrolling interests |
(33,814) |
(36,724) |
(85,521) |
(34,909) |
(44,813) |
(70,538) |
(92,414) |
|||||||
|
Net (loss) income attributable to Alexandria Real Estate Equities, Inc.’s |
(72,783) |
361,653 |
(1,080,875) |
(232,754) |
(107,002) |
288,870 |
(115,941) |
|||||||
|
Net income attributable to unvested restricted stock awards |
(908) |
(2,779) |
(965) |
(2,183) |
(2,609) |
(2,149) |
(5,269) |
|||||||
|
Net (loss) income attributable to Alexandria Real Estate Equities, Inc.’s |
$ (73,691) |
$ 358,874 |
$ (1,081,840) |
$ (234,937) |
$ (109,611) |
$ 286,721 |
$ (121,210) |
|||||||
|
Net (loss) income per share attributable to Alexandria Real Estate Equities, |
||||||||||||||
|
Basic |
$ (0.43) |
$ 2.10 |
$ (6.35) |
$ (1.38) |
$ (0.64) |
$ 1.68 |
$ (0.71) |
|||||||
|
Diluted |
$ (0.43) |
$ 2.10 |
$ (6.35) |
$ (1.38) |
$ (0.64) |
$ 1.68 |
$ (0.71) |
|||||||
|
Weighted-average shares of common stock outstanding: |
||||||||||||||
|
Basic |
170,718 |
170,598 |
170,394 |
170,181 |
170,135 |
170,658 |
170,328 |
|||||||
|
Diluted |
170,718 |
170,867 |
170,394 |
170,181 |
170,135 |
171,040 |
170,328 |
|||||||
|
Dividends declared per share of common stock |
$ 0.72 |
$ 0.72 |
$ 0.72 |
$ 1.32 |
$ 1.32 |
$ 1.44 |
$ 2.64 |
|||||||
|
Consolidated Balance Sheets |
||||||||||
|
6/30/26 |
3/31/26 |
12/31/25 |
9/30/25 |
6/30/25 |
||||||
|
Assets |
||||||||||
|
Investments in real estate |
$ 29,125,895 |
$ 28,830,116 |
$ 28,689,996 |
$ 31,743,917 |
$ 32,160,600 |
|||||
|
Investments in unconsolidated real estate joint ventures |
28,910 |
30,520 |
30,677 |
39,601 |
40,234 |
|||||
|
Cash and cash equivalents |
470,449 |
418,720 |
549,062 |
579,474 |
520,545 |
|||||
|
Restricted cash |
4,690 |
4,665 |
4,693 |
4,705 |
7,403 |
|||||
|
Tenant receivables |
7,661 |
7,362 |
6,672 |
6,409 |
6,267 |
|||||
|
Deferred rent |
1,209,722 |
1,200,047 |
1,179,403 |
1,257,378 |
1,232,719 |
|||||
|
Deferred leasing costs |
453,761 |
456,405 |
458,311 |
505,241 |
491,074 |
|||||
|
Investments |
1,685,695 |
1,536,419 |
1,501,249 |
1,537,638 |
1,476,696 |
|||||
|
Other assets |
1,645,443 |
1,683,143 |
1,661,772 |
1,700,785 |
1,688,091 |
|||||
|
Total assets |
$ 34,632,226 |
$ 34,167,397 |
$ 34,081,835 |
$ 37,375,148 |
$ 37,623,629 |
|||||
|
Liabilities, Noncontrolling Interests, and Equity |
||||||||||
|
Secured notes payable |
$ — |
$ — |
$ — |
$ — |
$ 153,500 |
|||||
|
Unsecured senior notes payable |
10,818,366 |
11,166,009 |
12,047,394 |
12,044,999 |
12,042,607 |
|||||
|
Unsecured senior line of credit and commercial paper |
1,994,508 |
1,353,986 |
353,161 |
1,548,542 |
1,097,993 |
|||||
|
Accounts payable, accrued expenses, and other liabilities |
2,513,526 |
2,154,782 |
2,397,073 |
2,432,726 |
2,360,840 |
|||||
|
Dividends payable |
130,468 |
128,880 |
127,771 |
230,603 |
229,686 |
|||||
|
Total liabilities |
15,456,868 |
14,803,657 |
14,925,399 |
16,256,870 |
15,884,626 |
|||||
|
Commitments and contingencies |
||||||||||
|
Redeemable noncontrolling interests |
9,119 |
9,234 |
58,788 |
58,662 |
9,612 |
|||||
|
Alexandria Real Estate Equities, Inc.’s stockholders’ equity: |
||||||||||
|
Common stock |
1,707 |
1,707 |
1,705 |
1,703 |
1,701 |
|||||
|
Additional paid-in capital |
15,585,296 |
15,763,321 |
15,497,760 |
16,669,802 |
17,200,949 |
|||||
|
Accumulated other comprehensive loss |
(33,027) |
(30,936) |
(29,395) |
(32,203) |
(27,415) |
|||||
|
Alexandria Real Estate Equities, Inc.’s stockholders’ equity |
15,553,976 |
15,734,092 |
15,470,070 |
16,639,302 |
17,175,235 |
|||||
|
Noncontrolling interests |
3,612,263 |
3,620,414 |
3,627,578 |
4,420,314 |
4,554,156 |
|||||
|
Total equity |
19,166,239 |
19,354,506 |
19,097,648 |
21,059,616 |
21,729,391 |
|||||
|
Total liabilities, noncontrolling interests, and equity |
$ 34,632,226 |
$ 34,167,397 |
$ 34,081,835 |
$ 37,375,148 |
$ 37,623,629 |
|||||
|
Funds From Operations and Funds From Operations per Share |
||||||||||||||
|
The following table presents a reconciliation of net income (loss) attributable to Alexandria’s common stockholders, the most directly comparable financial measure presented in accordance with U.S. generally |
||||||||||||||
|
Three Months Ended |
Six Months Ended |
|||||||||||||
|
6/30/26 |
3/31/26 |
12/31/25 |
9/30/25 |
6/30/25 |
6/30/26 |
6/30/25 |
||||||||
|
Net (loss) income attributable to Alexandria’s common stockholders – basic and diluted |
$ (73,691) |
$ 358,874 |
$ (1,081,840) |
$ (234,937) |
$ (109,611) |
$ 286,721 |
$ (121,210) |
|||||||
|
Depreciation and amortization of real estate assets |
302,238 |
303,296 |
319,865 |
338,182 |
343,729 |
605,534 |
683,110 |
|||||||
|
Noncontrolling share of depreciation and amortization from consolidated real estate JVs |
(31,518) |
(29,473) |
(39,942) |
(45,327) |
(36,047) |
(60,991) |
(69,458) |
|||||||
|
Our share of depreciation and amortization from unconsolidated real estate JVs |
805 |
914 |
855 |
852 |
942 |
1,719 |
1,996 |
|||||||
|
Gain on sales of real estate |
— |
— |
(307,132) |
(9,824) |
— |
— |
(13,165) |
|||||||
|
Impairment of real estate – rental properties and land |
222,470 |
(1) |
5,499 |
1,439,303 |
323,870 |
131,090 |
227,969 |
131,090 |
||||||
|
Allocation to unvested restricted stock awards |
(2,201) |
(2,181) |
(1,903) |
(1,648) |
(1,222) |
(5,877) |
(1,916) |
|||||||
|
Funds from operations attributable to Alexandria’s common stockholders – diluted(2) |
418,103 |
636,929 |
329,206 |
371,168 |
328,881 |
1,055,075 |
610,447 |
|||||||
|
Unrealized (gains) losses on non-real estate investments |
(131,933) |
10,332 |
(98,548) |
(18,515) |
21,938 |
(121,601) |
90,083 |
|||||||
|
Significant realized losses on non-real estate investments |
— |
— |
103,329 |
— |
— |
— |
— |
|||||||
|
Impairment of non-real estate investments |
8,998 |
(3) |
12,448 |
20,181 |
25,139 |
39,216 |
21,446 |
50,396 |
||||||
|
Impairment of real estate |
— |
— |
12,619 |
— |
7,189 |
— |
39,343 |
|||||||
|
(Gain) loss on early extinguishment of debt |
— |
(366,435) |
— |
107 |
— |
(366,435) |
— |
|||||||
|
Acceleration of stock compensation expense due to executive officer resignation |
— |
— |
2,455 |
— |
— |
— |
— |
|||||||
|
(Decrease) increase in provision for expected credit losses on financial instruments |
— |
— |
(341) |
— |
— |
— |
285 |
|||||||
|
Allocation to unvested restricted stock awards |
909 |
2,674 |
(363) |
(74) |
(794) |
3,541 |
(2,116) |
|||||||
|
Funds from operations attributable to Alexandria’s common stockholders – diluted, as |
$ 296,077 |
$ 295,948 |
$ 368,538 |
$ 377,825 |
$ 396,430 |
$ 592,026 |
$ 788,438 |
|||||||
Refer to “Definitions and reconciliations” in the Supplemental Information for additional details.
|
(1) |
Primarily reflects impairment charges to reduce the carrying amounts of the following real estate assets classified as held for sale as of 2Q26 to their respective estimated fair values less costs to sell, including (i) $64.2 million related to a land parcel in Sorrento Mesa that is expected to be sold to a residential developer, (ii) $61.6 million, including $8.9 million attributable to foreign currency translation, related to one operating property in Canada, which was classified as held for sale following our decision to sell the asset and reallocate the substantial near-term capital that its redevelopment would have required toward other projects with greater value-creation opportunities, (iii) $28.2 million related to one land parcel and five operating properties, primarily comprising non-laboratory space, in our Sorrento Valley submarket, which were 30% occupied as of 2Q26, had a weighted-average lease term of 2.4 years, and would have required significant capital investment to convert to laboratory use, and (iv) $24.8 million related to one vacant office property, aggregating 104,956 RSF, in the Cambridge submarket of our Greater Boston market, for which we elected not to pursue a conversion to laboratory space. |
|
(2) |
Calculated in accordance with standards established by the Nareit Board of Governors. |
|
(3) |
Primarily related to two non-real estate investments in privately held entities that do not report NAV. |
The following table presents a reconciliation of net income (loss) per share attributable to Alexandria’s common stockholders, the most directly comparable financial measure presented in accordance with GAAP, including our share of amounts from consolidated and unconsolidated real estate joint ventures, to funds from operations per share attributable to Alexandria’s common stockholders – diluted, and funds from operations per share attributable to Alexandria’s common stockholders – diluted, as adjusted, for the periods below. Per share amounts may not add due to rounding.
|
Three Months Ended |
Six Months Ended |
|||||||||||||
|
6/30/26 |
3/31/26 |
12/31/25 |
9/30/25 |
6/30/25 |
6/30/26 |
6/30/25 |
||||||||
|
Net (loss) income per share attributable to Alexandria’s common stockholders – diluted |
$ (0.43) |
$ 2.10 |
$ (6.35) |
$ (1.38) |
$ (0.64) |
$ 1.68 |
$ (0.71) |
|||||||
|
Depreciation and amortization of real estate assets |
1.59 |
1.61 |
1.65 |
1.73 |
1.81 |
3.19 |
3.61 |
|||||||
|
Gain on sales of real estate |
— |
— |
(1.80) |
(0.06) |
— |
— |
(0.08) |
|||||||
|
Impairment of real estate – rental properties and land |
1.30 |
0.03 |
8.45 |
1.90 |
0.77 |
1.33 |
0.77 |
|||||||
|
Allocation to unvested restricted stock awards |
(0.02) |
(0.01) |
(0.02) |
(0.01) |
(0.01) |
(0.03) |
(0.01) |
|||||||
|
Funds from operations per share attributable to Alexandria’s common stockholders – |
2.44 |
3.73 |
1.93 |
2.18 |
1.93 |
6.17 |
3.58 |
|||||||
|
Unrealized (gains) losses on non-real estate investments |
(0.77) |
0.06 |
(0.58) |
(0.11) |
0.13 |
(0.71) |
0.53 |
|||||||
|
Significant realized losses on non-real estate investments |
— |
— |
0.61 |
— |
— |
— |
— |
|||||||
|
Impairment of non-real estate investments |
0.05 |
0.07 |
0.12 |
0.15 |
0.23 |
0.13 |
0.30 |
|||||||
|
Impairment of real estate |
— |
— |
0.07 |
— |
0.04 |
— |
0.23 |
|||||||
|
(Gain) loss on early extinguishment of debt |
— |
(2.14) |
— |
— |
— |
(2.14) |
— |
|||||||
|
Acceleration of stock compensation expense due to executive officer resignation |
— |
— |
0.01 |
— |
— |
— |
— |
|||||||
|
Allocation to unvested restricted stock awards |
0.01 |
0.01 |
— |
— |
— |
0.01 |
(0.01) |
|||||||
|
Funds from operations per share attributable to Alexandria’s common stockholders – |
$ 1.73 |
$ 1.73 |
$ 2.16 |
$ 2.22 |
$ 2.33 |
$ 3.46 |
$ 4.63 |
|||||||
|
Weighted-average shares of common stock outstanding – diluted |
||||||||||||||
|
Earnings per share – diluted |
170,718 |
170,867 |
170,394 |
170,181 |
170,135 |
171,040 |
170,328 |
|||||||
|
Funds from operations – diluted, per share |
171,210 |
170,867 |
170,504 |
170,305 |
170,192 |
171,040 |
170,390 |
|||||||
|
Funds from operations – diluted, as adjusted, per share |
171,210 |
170,867 |
170,504 |
170,305 |
170,192 |
171,040 |
170,390 |
|||||||
Refer to “Definitions and reconciliations” in the Supplemental Information for additional details.
 View original content to download multimedia:https://www.prnewswire.com/news-releases/alexandria-real-estate-equities-inc-reports-2q26-and-1h26-net-loss-income-per-share–diluted-of-0-43-and-1-68–respectively-and-2q26-and-1h26-ffo-per-share–diluted-as-adjusted-of-1-73-and-3-46–respectively-302841464.html
SOURCE Alexandria Real Estate Equities, Inc.