LexisNexis U.S. Insurance Demand Meter: Auto Insurance Shopping Volumes Remain Elevated as Shopping Growth Holds Steady in Q3 2026
ATLANTA, Nov. 12, 2026

Press Release Disclaimer: This is a press release distributed through the XPR Media network. It has not been independently verified by our newsroom.

LexisNexis U.S. Insurance Demand Meter: Auto Insurance Shopping Volumes Remain Elevated as Shopping Growth Holds Steady in Q3 2026
PR Newswire
ATLANTA, Nov. 12, 2026
ATLANTA, Nov. 12, 2026 /PRNewswire/ — U.S. consumer auto insurance shopping and new policy growth remained in “Warm” territory according to the LexisNexis® U.S. Insurance Demand Meter. Shopping volumes remained high, and auto insurance shopping and new business growth were positive but decelerated slightly quarter-over-quarter, according to the latest report from LexisNexis® Risk Solutions.
Key Takeaways:
- Shopping growth eased but stayed “warm”: The quarterly year-over-year (YoY) shopping growth rate was 0.7%, down from 1.4% in Q2 2026.
- Annual shopping remained near record levels: 47.2% of policies-in-force were shopped at least once in the previous 12 months.
- Exclusive agent channel momentum persisted: The exclusive agent distribution channel outpaced both direct and independent agent channels for the second consecutive quarter.
- Non-Standard shoppers grew in Q3: Non-standard shopping outpaced standard
shopping and posted positive growth for the first time in 2026. - New analysis regarding policies leaving underscores retention pressure: Over a 60-day period, one in two lost policies switched to a new insurer, and first-year policyholders represent 40% of lost policies.
- Download the latest LexisNexis U.S. Insurance Demand Meter.
Quarterly Shopping Rate Remained Positive
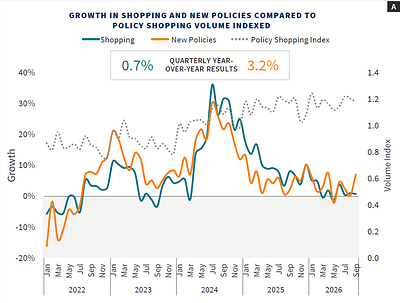
- Quarterly year-over-year shopping growth was 0.7%, down from 1.4% in Q2, and new business growth hit 3.2%, down slightly from last quarter’s 3.3%. Each remained in “Warm” territory for the third consecutive quarter.
- Download the full LexisNexis U.S. Insurance Demand Meter report to see monthly year-over-year shopping volumes, weekly shopping volumes and new policy volumes.
Annual Auto Insurance Shopping Activity Hovered Near Record Levels
- At the end of Q3, 47.2% of policies-in-force had been shopped at least once in the previous 12 months. This remained unchanged from Q2 and is a fraction of a percentage point down from the record 47.3% achieved in Q1.
- Consistency in both the quarterly and annual shop rate may reflect a broader shift in how policyholders approach shopping. Sustained, elevated shopping levels suggest some consumers are more regularly evaluating their policy options, particularly if the opportunity for more favorable premiums arises, according to LexisNexis Risk Solutions consumer research cited in this quarter’s Demand Meter.
- Download the full LexisNexis U.S. Insurance Demand Meter report to learn more about annual shop rates from 2023 to 2026.
“Consumers remain highly sensitive to rate changes, which has helped keep auto insurance shopping volumes elevated. As the market continues to evolve, rate increases may no longer be the only dominant driver of shopping activity,” said Jeff Batiste, senior vice president and general manager, U.S. auto and home insurance, LexisNexis Risk Solutions. “Broader affordability pressures continue to shape household decisions, prompting consumers to take a closer look at what they are paying and the value they receive from their coverage. For insurers, understanding these shifting motivations will be critical to identifying the right opportunities and engaging consumers with the right offer.”
Exclusive Insurance Agent Channels Led Q3 Growth and Non-Standard Shoppers Shifted Significantly
- Last quarter, exclusive agent channel growth was 6.8% and landed at 4.5% in Q3.
- Non-standard shopping outpaced standard shopping and posted positive growth for the first time in 2026. Non-standard shoppers experienced 5.4% growth, up from -9% in Q2.
- In Q3, standard shopping remained positive, but dipped to 1.3%, from 2.6% in the second quarter.
- Download the full LexisNexis U.S. Insurance Demand Meter report to learn how the distribution channel mix reflects policyholder shopping preferences.
Michigan and New Jersey Led U.S. Auto Insurance Shopping Growth
- Twenty-eight states posted positive growth in Q3, compared with 42 states in Q2 and 37 states in Q1 2026.
- Michigan led all states in Q3 2026 with 7% shopping growth, followed by New Jersey at 6.8%. Connecticut and Georgia each generated 6.6% growth, while Nevada rounded out the top five states exhibiting positive growth at 6.2%.
- Download the full LexisNexis U.S. Insurance Demand Meter report to learn how auto insurance shopping growth in other U.S. states compares in Q3 2026 and to learn more about auto policy shopping trends across age groups.
New Market Analysis: What Happens When Policies Leave?
- Policies lost over a 60-day period account for 18% of active policies annually.
- Of that 18%, nearly 30% of those lost policies exit the market while roughly 70% remain active. This active cohort either switches insurance carriers, returns to the original carrier or moves from having dual coverage to a single insurer.
- First-year policyholders are a particularly vulnerable segment as they represent 40% of lost policies and more than 50% of market exits.
- Download the full LexisNexis U.S. Insurance Demand Meter report to learn more about this market analysis and trends driving these cohorts and lost policies.
Looking Ahead
Third-quarter trends remained consistent with what the market experienced in the first half of 2026. Shopping and switching remain at record highs, and while growth in each has slowed, they continue to reach higher levels. Typically, there is a shopping lull in the fourth quarter; however, against a backdrop of consumer affordability pressures, the prevalence of artificial intelligence and the onset of agentic shopping, the market may once again buck that trend.
LexisNexis U.S. Insurance Demand Meter
The LexisNexis® U.S. Insurance Demand Meter is a quarterly analysis of auto insurance shopping volume and frequency, new business volume and related data points. LexisNexis Risk Solutions offers this unique market-wide perspective of U.S. consumer auto insurance shopping and switching behavior based on its analysis of consumer shopping transactions since 2009, representing nearly 90% of the universe of U.S. insurance shopping activity.
About LexisNexis Risk Solutions
LexisNexis® Risk Solutions provides customers with information-based analytics and decision tools that combine public and industry-specific content with advanced technology and algorithms to assist them in evaluating and predicting risk and enhancing operational efficiency. Headquartered in metro Atlanta, Georgia, the company has offices throughout the world, serves customers in more than 190 countries and territories and is part of RELX. For more information, please visit LexisNexis Risk Solutions and RELX.
Media Contacts:
Annalysce Baker
LexisNexis Risk Solutions
Phone: +1 678.436.1579
annalysce.baker@lexisnexisrisk.com
 View original content to download multimedia:https://www.prnewswire.com/news-releases/lexisnexis-us-insurance-demand-meter-auto-insurance-shopping-volumes-remain-elevated-as-shopping-growth-holds-steady-in-q3-2026-302938168.html
SOURCE LexisNexis Risk Solutions